
Buy High, Sell Higher

Whether you have cash on the sidelines or are fully invested in a diversified portfolio, nothing turns investors into pessimists faster than the phrase, “the market is at all-time highs.” Perhaps it’s human nature to expect the good times to end or maybe the phrase “buy low, sell high” has been drilled into every investor’s mindset from day one.
With the market once again pushing all-time highs, we felt compelled to examine:
1) How often does the market reach new all-time highs?
2) Should we sell high?
3) How do various strategies perform at all-time highs?
How Often Does the Market Reach New All-Time Highs?
All-time high sounds prestigious. If nothing else, it sounds like a special event that should be celebrated despite the contrarian mindset it tends to bestow on investors around the globe. But all-time highs are not that special. Looking back to 1988, the S&P 500 has hit a new all-time high on 10.1% of all trading days. With five trading days every week, this tells us that, on average, the market has hit a new high once every two weeks for the past 30+ years.
Exhibit 1
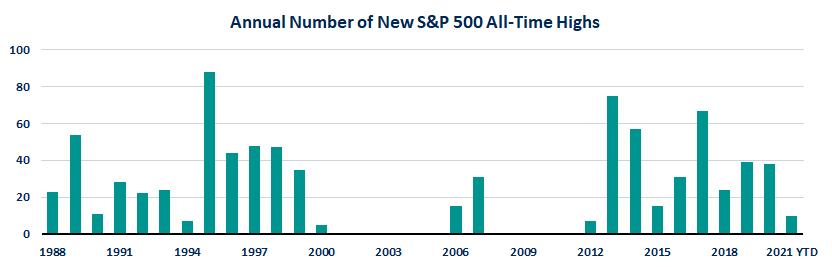
Chart illustrates the number of new all-time highs the S&P 500 made each calendar year. Data from 1/1/1988 – 2/24/2021. Source: Morningstar Direct, Savant Wealth Analysis.
History demonstrates that it is fairly common for the S&P 500 to reach new highs not just once a year, but often times it will hit new highs 30, 40, 50, or more times in a given year. Unfortunately, there is no pattern to this information so while Exhibit 1 illustrates that stocks frequently make new all-time highs, it does not tell us whether or not to invest (or remain invested) as markets continue to hit fresh all-time highs.
Should We Sell High?
Young and old, every investor knows the phrase. Buy low and sell high. By those standards, you have won the game and should sell when the market hits a new all-time high. Compound that with the 24/7 news cycle that instills the fear that you’ll lose your hard-earned nest egg. According to the media, this time is always different. There is always a new indicator flashing red. But what does the evidence tell us?
Exhibit 2
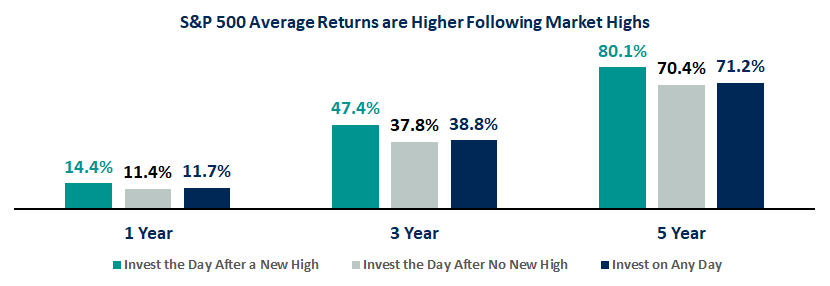
Data from 1/1/1988 – 2/24/2021. Source: Morningstar Direct, Savant Wealth Analysis. Returns are cumulative.
Contrary to conventional wisdom, Exhibit 2 illustrates that the S&P 500 has generated higher returns over the 1-, 3-, and 5-year periods after setting a record high compared to periods that the index is not coming off a record high. Of course, if a few outlier scenarios skewed our data, exhibit 2 could mislead us into taking on undue risk. As we look deeper into this possibility, Exhibit 3 shows us that the S&P 500 garnered positive returns over 80% of the time in the years following a market high. Beyond that, in the less frequent occasions where the S&P 500 fell following a market high, losses were limited relative to the large gains investors harvested by remaining invested.
Exhibit 3
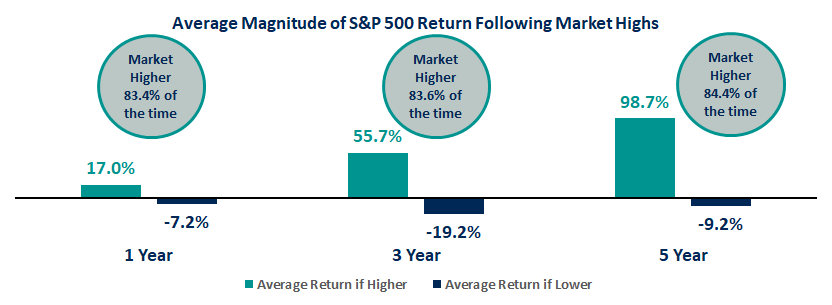
Data from 1/1/1988 – 2/24/2021. Source: Morningstar Direct, Savant Wealth Analysis. Returns are cumulative.
How do popular strategies compare?
As markets hit all time highs, many investors with cash to invest choose one of three options: hold cash, dollar-cost average (a strategy to invest an equal dollar amount across periodic purchases to reduce volatility and avoid attempts at market timing), or invest all of the cash in the market. To compare these strategies, we will look at the period starting April 3rd, 2012. While this date may seem arbitrary, it is the day after the S&P 500 set its first new high following the Great Financial Crisis. Naturally, this market high may have been a bit more uneasy with the subprime mortgage crisis squarely in the rear-view mirror. We will assume each investor has $100,000 and that the dollar-cost average investor will invest $5,000 into the market every 30 days until they have fully invested their cash.
Exhibit 4
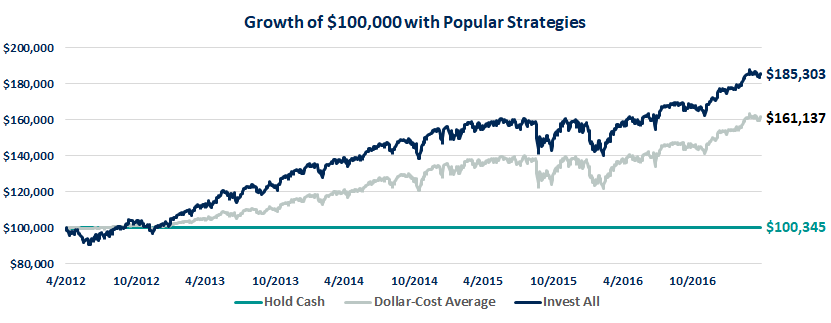
Chart above is for illustrative purposes only. This is a hypothetical example and not representative of actual results. Data from 4/3/2012 – 3/31/2017. Source: Morningstar Direct, Savant Wealth Analysis. Returns are cumulative. Cash is represented by the IA SBBI US 30 Day TBill Index.
How did the strategies compare? Within a few months from the start, the investor who chose to place the entire $100,000 in the S&P 500 lost almost 10%. Certainly not a great start. But as evidence has shown by accepting a higher level of risk, this investor also allocated to the highest expected return scenario. As the data has shown, the investor placing all their money in the market from the start saw their balance grow to approximately $185,000 – an 85.3% gain over the 5-year period studied.
Interestingly, the dollar-cost averager had a fairly successful experience as well. Early on, when the S&P 500 struggled, this approach experienced losses of less than one percent. However, over the long run, the dollar-cost averager missed the full force of market gains on their way to a final balance of just over $160,000. Unsurprisingly, the investor who held cash realized the smallest of gains – adding approximately $300 to their starting balance over the 5-year period.
History Doesn’t Repeat Itself, but It Often Rhymes
We can never know what the market has in store around the corner. Through an evidence-based approach, we can know which outcomes are more likely as we look to the future. After reviewing the data, evidence tells us that market highs are not that rare and tend to occur in bunches. Perhaps contrary to popular belief, S&P 500 returns have been higher in years following fresh market highs than days without market highs.
We believe this reaffirms that the best time to invest was yesterday, but today is a close second. While holding cash feels safe, the evidence tells us that it can be the proverbial shot in your own foot for long-term investors. Dollar-cost averaging has also shown itself to be an effective strategy to manage risk and emotions while still capturing some of the benefit from investing long term. However, neither of these approaches appears to match the simple strategy of taking the plunge and investing the cash from the start. Because wealth is generally created not from timing the market, but from time in the market.
This is intended for informational purposes only and should not be construed as personalized investment or financial advice. Past performance is no guarantee of future results.
 Eamon M. Verdone
Corporate Development and Integration Associate
Eamon M. Verdone
Corporate Development and Integration Associate