
Inflation Surging and a Deteriorating Dollar: Real Risks or Just for Clicks?

Following the passage of another trillion-plus dollar stimulus bill, chatter about the prospects for intensifying inflation and the demise of the U.S. dollar have been on the rise. With global stocks up more than 50% over the past 12 months, some investors have surmised that problems must lie ahead. Recently, in a separate study, we reviewed how investors tend to fare when investing at market highs, which implies the good times might continue rolling. Neither the Fed nor markets seem concerned. On the other hand, fiscal stimulus was employed at a record level in partnership with accommodative monetary policy to soften near-term impacts of the pandemic on our economy. So just how likely is it that these risks come to fruition? Applying a data-driven framework, we find that well-diversified investors may have less to fear than some pundits imply in attempt to draw an audience.
Inflation: Transitory or Concerning?
The risk of upside surprise to inflation has been discussed since the early days of quantitative easing when the Fed’s balance sheet jumped from mere billions into the trillions. The Fed has been trying, and failing, to push inflation up to a healthy 2% per year in the U.S. for the past decade. But following the COVID crisis, the U.S. saw liquidity injections like no other time in history. By way of the M2 Money Stock (a measure including most cash in the U.S.) Exhibit 1 highlights just how much money was created in light of this crisis.
Exhibit 1
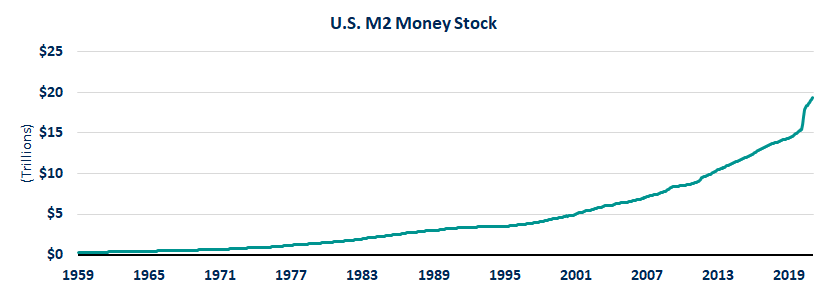
Source: St. Louis Fed
From 1950 through February 2020, the money supply increased from about $300 billion to $15 trillion. In the year since then, an additional $4 trillion was added to the money supply! Said differently, over 25% of the dollars created since 1959 were generated within the last 12 months. If there was a recipe for inflation, that would seem to be a key ingredient. Surprisingly, that may not be the case.
In 1981, the Paul Volcker-led Federal Reserve raised the federal funds rate to a level that squashed the surging inflation of the 1970s. In the 40 years since, the market has assumed the Fed would step in should inflation get out of control.
Exhibit 2
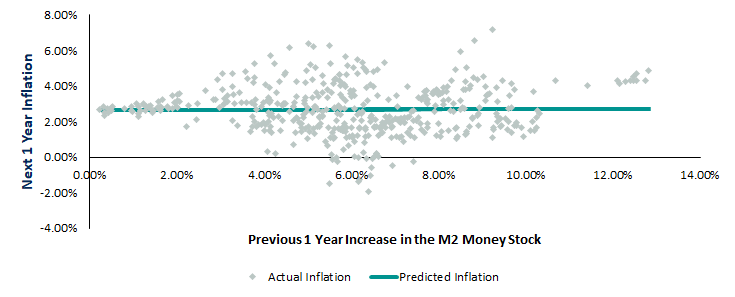
Source: St. Louis Fed, Savant Wealth Analysis
Simple economics be damned, Exhibit 2 shows us that for the past 40 years there has been no relationship between increases in the money supply and ensuing inflation. If we regress the data, it tells us we should expect inflation to come in at 2.63% over the next year. While this is higher than the realized U.S. inflation in recent years, the Fed has refreshed their mandate to target an average of 2% inflation over time. This means the Fed is unlikely to flinch should inflation figures come in with a 2-handle.
That’s a simple estimate and leaves room for error. To better triangulate our estimate for inflation, we can use the 10-year breakeven inflation rate. This inflation estimate is derived from the pricing of U.S. Treasury securities. With hundreds of billions of dollars of Treasuries trading hands each day, they likely represent the market’s best estimate of forward inflation. After all, these trades represent individuals and institutions putting their money where their mouth is. As of March 18th, this more technical indicator is estimating a 2.27% annualized inflation rate in the coming decade. While this is the strongest inflation estimate this metric has shown since 2014 it still falls short of our simple estimate based on the meteoric rise of the M2 money supply.
Based on our time horizon and data-driven methodology, we believe inflation might range from 2.2% – 2.6% over the next ten years. While this does represent an increase in realized inflation relative to the last decade, we think the Fed would be thrilled with this level of inflation.
Strength of the U.S. Dollar
Markets appear to believe inflation is not a significant threat, so we turn our attention to the Dollar.
The first U.S. Dollar was printed in 1914. About 60 years later, the U.S. Dollar (USD) officially became the world’s reserve currency. Today, the USD represents over 60% of the world reserve currency basket. Being a reserve currency means that central banks and financial institutions around the globe maintain assets in said currency to facilitate international transactions. Approximately 40% of the world’s debt is denominated in USD and most global commodities are priced in USD. When organizations around the globe want oil, wheat, gold, or cattle, they spend USD. Suffice it to say, the USD is entrenched in the global economy.
When we talk currencies, it is important to reiterate –they have no intrinsic values. There is no future cash flow linked to holding a U.S. Dollar like there is a stock or bond. Rather, currencies are valued relative to other currencies. The U.S. Dollar has made news recently for its value falling after years of strengthening. Exhibit 3 illustrates that while the value of the dollar has fallen in recent months, it is close to its long-term highs relative to other currencies.
Exhibit 3
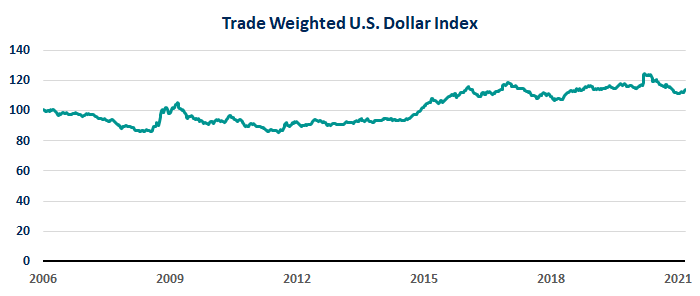
Source: St. Louis Fed
The drivers of currency exchange rates are complex and dynamic, but three key factors are economic growth, interest rates, and trade balances.
Exhibit 4
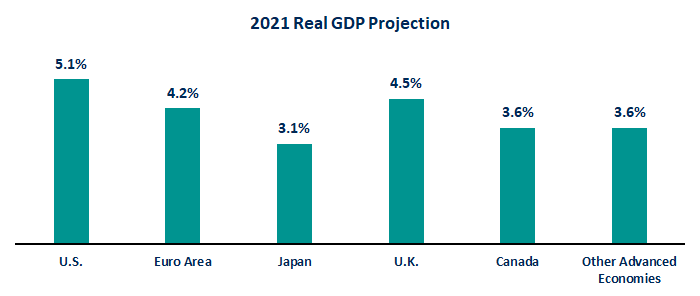
Source: International Monetary Fund, January 2021
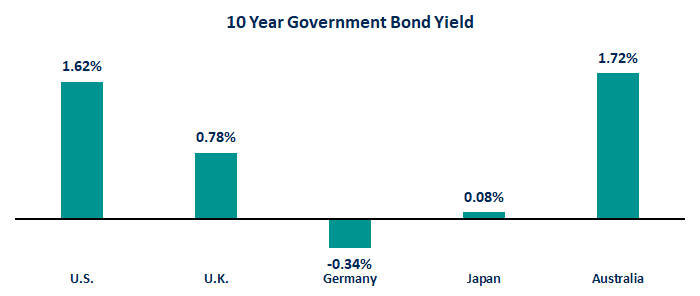
Source: Bloomberg, 3/16/2021
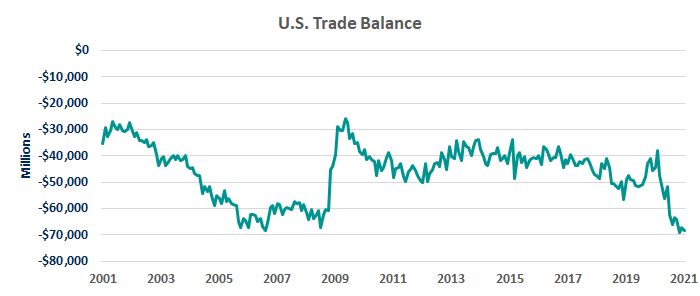
Source: St. Louis Fed, 3/5/2021
Let’s digest Exhibit 4 piece by piece. Economic growth is important in determining the value of a currency as it projects the future strength of the home country. Based on current projections of the International Monetary Fund, the U.S. appears to be positioned among the strongest of developed economies for future growth. Interest rates are also important because currencies with higher interest rates tend to attract more capital, supporting the value of the currency. Again, the U.S. appears among the strongest among developed countries. Furthermore, we have seen evidence that the Fed is willing to raise interest rates should inflation rear its ugly head – giving upside (from a U.S. perspective) to our data in Exhibit 4. Finally, the trade balance data – which impacts currency exchange rates through supply and demand – is not great for the U.S., but we do see that current data looks fairly in line with the past 20 years. Similar to the inflation expectations, the prognosis for the future of the U.S. Dollar do not look so bad when we dive into the data.
But What If We’re Wrong?
Unfortunately, we do not have a crystal ball. That is why we diversify. As investors, we must find investments that not only smooth the short-term hiccups but provide long-term benefits that ensure our financial plan remains intact. Many investors turn to gold, or other precious metals, when concerned about significant inflation or a collapsing U.S. dollar.
Exhibit 5
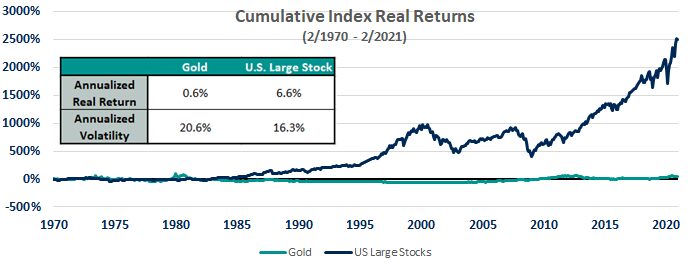
Source: St. Louis Fed, Morningstar Direct. Data as of 2/28/2021
Exhibit 5 demonstrates that gold has barely kept pace with inflation (real return of only 0.6%) over the past 50 years. While gold may have attractive short-term properties for investors who can time markets (if there are any), it may not be a reliable asset to help investors achieve their financial goals and keep their financial plan on track. So, the hunt turns to assets that have both positive long-term expected returns and diversifying properties in periods of high inflation and/or a crumbling U.S. Dollar.
Treasury Inflation-Protected Securities (TIPS) are a natural fit. These bonds, first issued in 1997 in the U.S., are backed by full faith of the U.S. government and the principal is adjusted for changes in inflation. The inflation adjustment makes TIPS a natural inflation hedge as part of a diversified portfolio. For strategies with a longer history, we can stress test them by reviewing just how they acted from January of 1973 through June 1980 – a period where investors were hammered by strong inflation and a flailing U.S. Dollar.
Exhibit 6
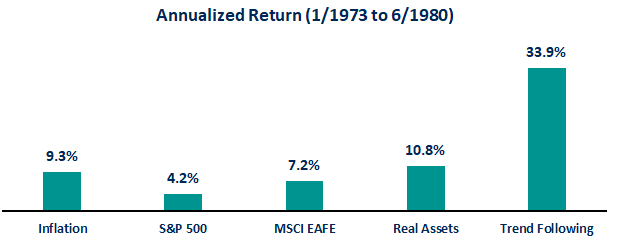
Source: Morningstar Direct. Data as of 3/17/2021
During this period, U.S. inflation compounded at over 9% per year and the S&P 500 returned a measly 4% each year on average. But three implementable strategies stand out as strong diversifiers:
- International stocks: Still trailing inflation, diversifying internationally helped investors to benefit from other strengthening currencies as well as economies in different parts of the business cycle.
- Real Assets: Investments in real assets can better withstand inflationary forces as the value of their land or real estate also tends to appreciate during these times in addition to their contractual nature that allows the asset owner to increase prices if necessary.
- Trend Following: Prolonged, strong trends in interest rates, currencies, or other asset classes can be a boon for trend following strategies regardless if the asset price is trending up or down.
There will always be doomsayers predicting hyperinflation or the end of the U.S. Dollar as we know it. As evidenced-based investors, we can dig into the data and make an informed judgement on likely outcomes. We may see inflation finally crack the 2% range the Fed has been aiming for in the coming years, but we believe a case of strong, unchallenged inflation seems unlikely.
The U.S. Dollar has weakened in recent months. It may see continued weakness in the near future, but some key factors point to a potential strengthening as well. Regardless of the eventual direction, the evidence does not appear to point to a wholesale collapse of the U.S. Dollar.
Despite what the media’s pundits or corners of the internet (often attempting to sell precious metals) might pronounce, it appears doomsday is not at the doorstep. Should surging inflation and/or a flailing Dollar rear their ugly heads, the inclusion of international stocks and modest allocations to TIPS, real assets, and trend following strategies should arm portfolios nicely for the battle while still contributing to the success of a long-term financial plan.
This is intended for informational purposes only. Past performance is no guarantee of future results. Please consult your investment professional regarding your unique situation.