
Inflation Moderating – The Page 8 Story
“The only thing that was transitory was the use of the word transitory” was how Jeff Gundlach, mincing no words, described the Federal Reserve’s handling of inflation recently. Gundlach, the CEO of DoubleLine Capital, is often referred to as the “Bond King,” so his words tend to carry weight.
It’s no secret – inflation has been bad and is getting worse, increasing with every monthly report since August. In March 2020, when the pandemic began, inflation was 1.5% – it’s currently at 8.5%, the highest level since the early 1980s.
Things feel bleak. But there’s reason to believe we may be through the worst of it.
Peter Lynch, of Fidelity investing fame, often said he was more interested in the stories on Page 8 of the business section rather than Page 1 because the stories on Page 1 were already reflected in the price. Inflation is, without a doubt, a Page 1 story.
When the most recent inflation report came out for April, Google searches for the word “inflation” hit an all-time high, with a history dating back to 2004.
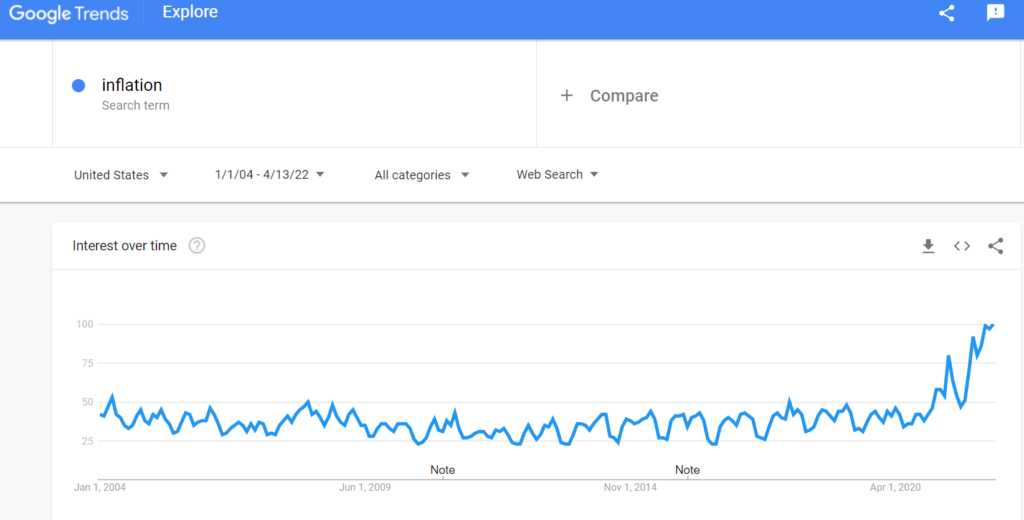
Source: Google Trends searches for the word “inflation,” April 2022
With that as context, it’s hard not to feel like inflation is “in the price,” if only anecdotally.
But as we look out into the world for tangible evidence, inflation may be peaking. There are some visible signs:
Mortgage Rates
A 30-year mortgage rate is now 5.1%, the highest level since January 2010, and up from 2.7% last August. That’s a pretty remarkable jump over a short period.
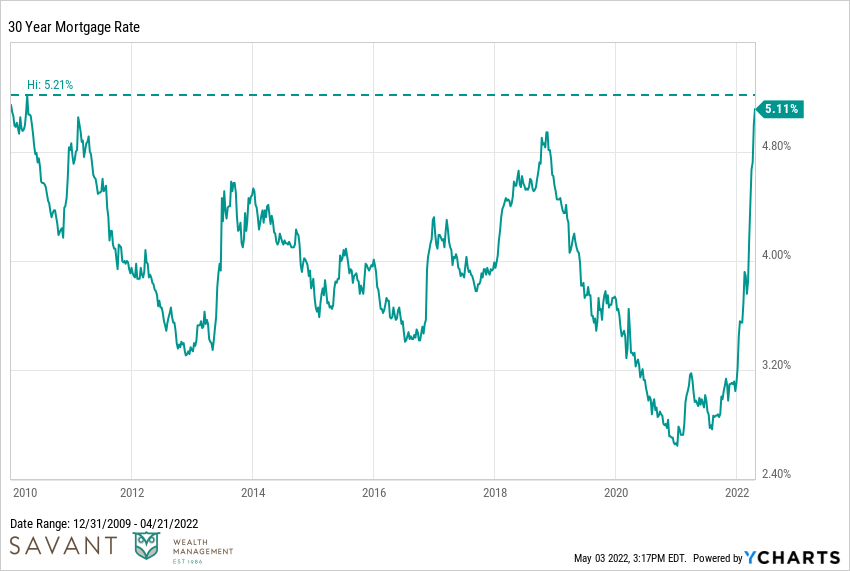
Housing costs have been a key inflation driver, as home prices increased at their fastest rate in more than 20 years. While home prices continue to climb, the pace of growth has slowed in five consecutive months, a possible indication that increasing costs could cool off the housing market.
Used Vehicle Prices
The price of used cars and trucks has soared behind a shortage in semiconductors, making it difficult to produce new cars. Used cars and trucks have been the fastest growing segment of the inflation index for four consecutive months, with growth rates ranging from 35% to 45% versus last year.
However, in consecutive months the rate of growth has slowed, similar to housing prices. Two months ago, the price of a used car was up 45% versus last year; that number is now down to “only” 25%, so again, the pace of growth is slowing.
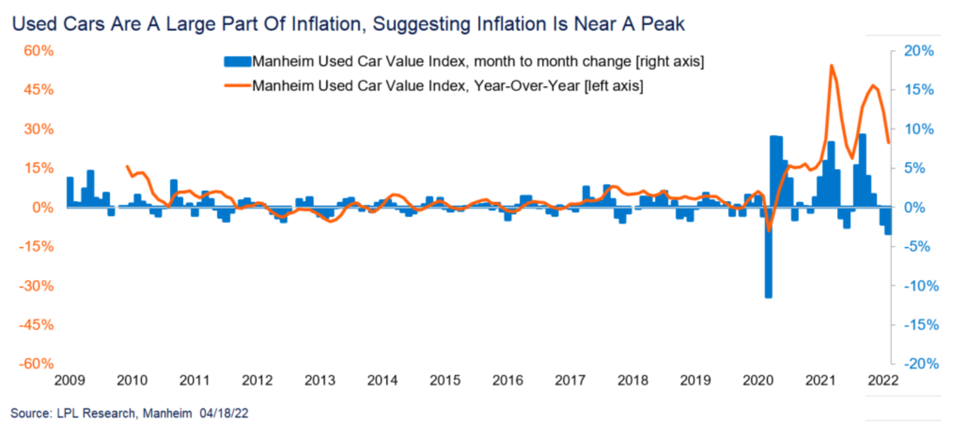
The month-over-month numbers have also declined in two consecutive months, showing some signs the excessive used car pricing could finally be cracking.
Congestion Easing at West Coast Ports
Roughly 40% of imported goods enter this country through the Ports of Long Beach and Los Angeles. For the better part of two years, prices of containers from China to Southern California spiked higher; pre-pandemic it cost roughly $1,700 to ship a container, and that price increased to more than $10,000 last fall.
But the good news is that major backlogs at those ports are finally thawing. Container shipping costs are falling and the number of ships waiting to unload has dropped considerably, which are both potentially good news for inflation.
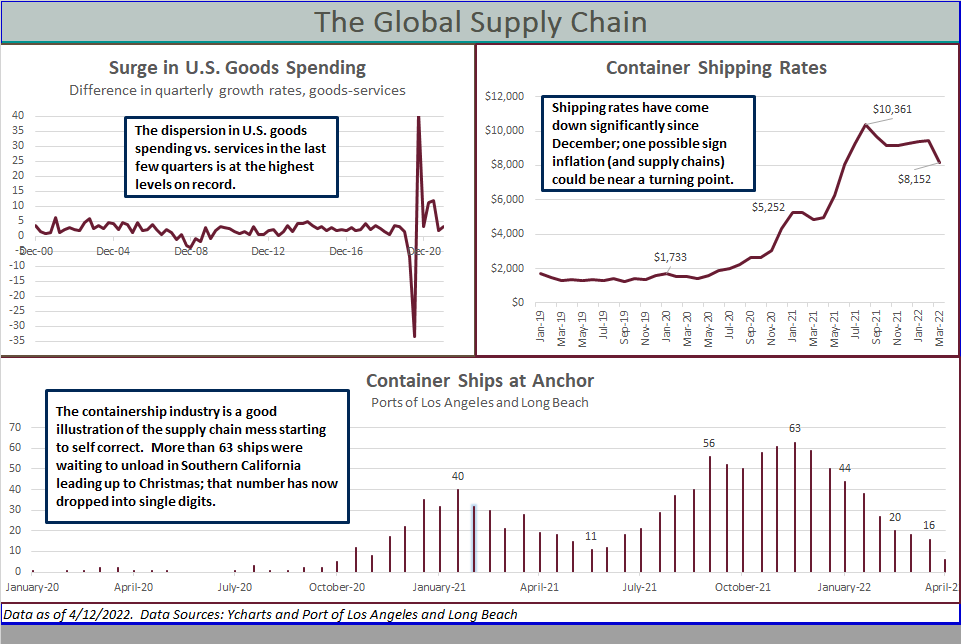
Data as of 4/12/2022. Data Sources: Ycharts and Port of Los Angeles and Long Beach
Flexible vs. Sticky Inflation
Not all inflation is the same. The Atlanta Federal Reserve breaks inflation into two categories: sticky and flexible.
As the name implies, sticky inflation refers to a set of items that change price slowly, things like motor vehicle fees, education, public transportation, and motor vehicle insurance. Flexible inflation includes items with prices that move more often – gas, food, clothes, and jewelry.
As you can see below, flexible inflation (the stuff that changes in price more rapidly) is the biggest perpetrator of inflation’s rise, up 20% versus last year.
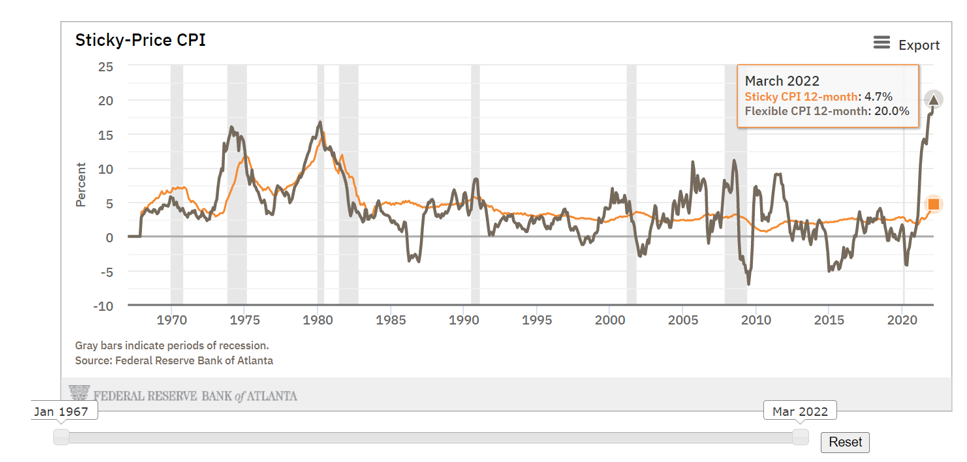
While not scientific, if flexible inflation can rise that rapidly, it’s not impossible that it could fall that rapidly too.
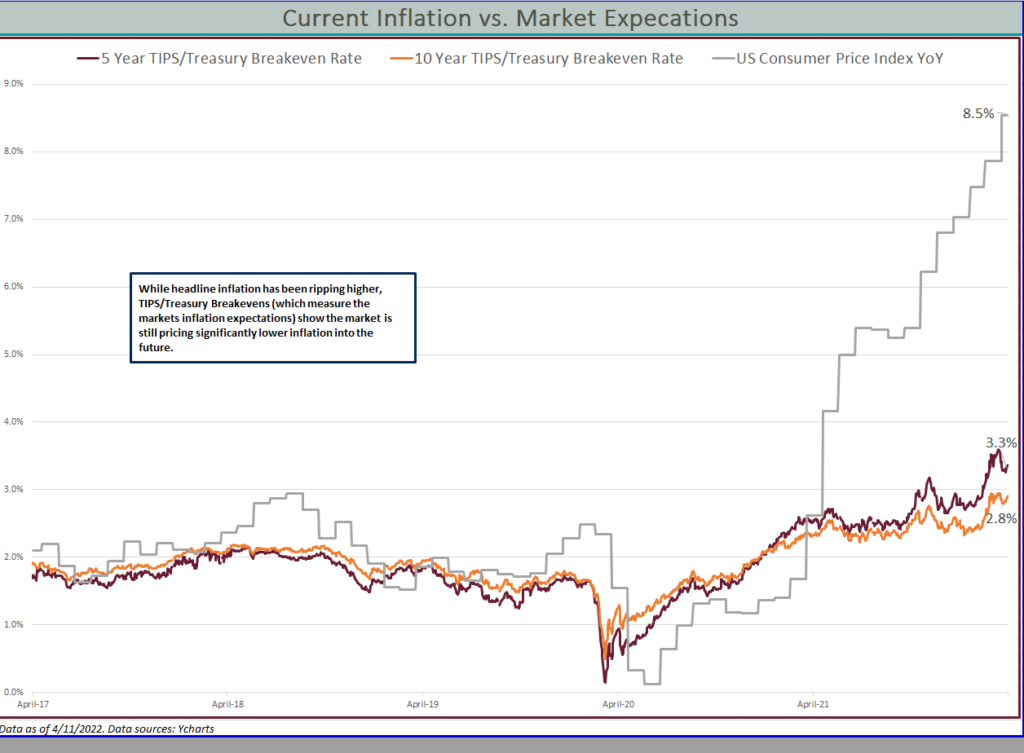
The Market Itself is not Pricing in Higher Inflation for Much Longer
Markets are efficient and do a good job of reflecting future expectations. On the topic of inflation, the market is not predicting higher inflation over the long term.
We can look at five- and 10-year Treasuries compared to Treasury Inflation-Protected Securities (TIPS) to get a better understanding of where the market stands on inflation. The five-year and 10-year inflation outlook is 2.8% and 3.3%, respectively, significantly below the 8.5% inflation now.
Given some of these signals, there are reasons to believe inflation could be topping out.
Like anything, uncertainty remains – we can’t be completely confident things will improve at a desired pace. We know the path back to “normal” inflation won’t happen quickly, but there are reasons to be optimistic it won’t spiral from here.
Inflation moderating is a Page 8 story that we hope will move up to Page 1.