
Handling Market Volatility is About Perspective. Is Your Glass Half Empty or Half Full?

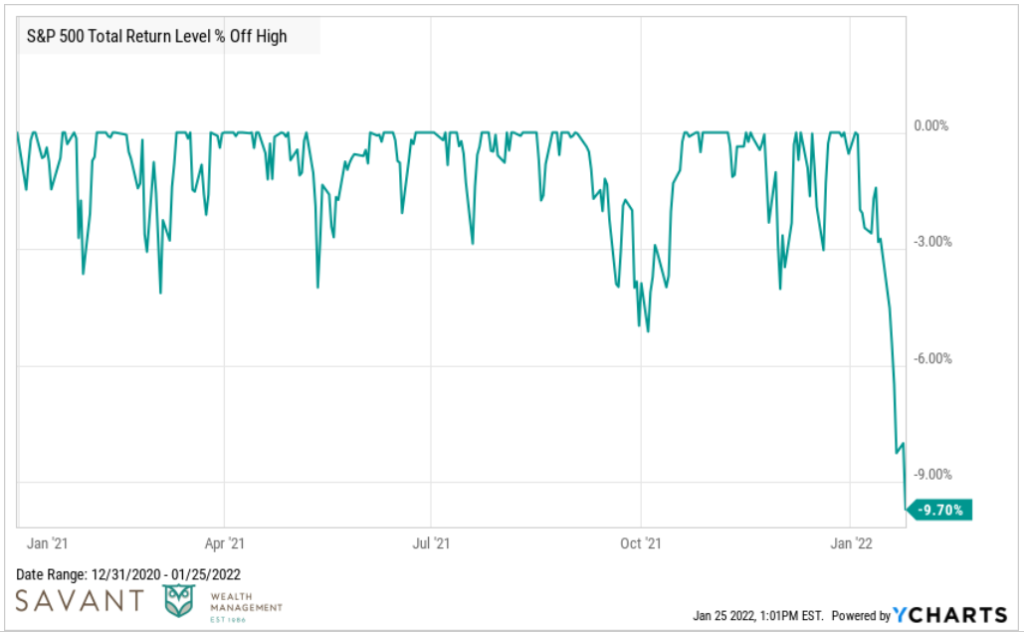
Let’s get the hard part out of the way first. We’re living through one of the quickest 10% market declines ever to start a year.
In the first three weeks in 2022, the S&P 500 has already declined more than it did at any point last year.
This market isn’t playing nice. Just last week, Netflix, a company with a $250 billion market cap reported its fourth quarter numbers. In October, the company predicted they would add 6.5 million new subscribers by year end, however, the subscriber number came in slightly below at 6.3 million.
For a minor miss, the market didn’t show any sympathy. Netflix shed nearly a quarter of its market cap, falling 24%. For Netflix shareholders, season two of Squid Game can’t get here soon enough.
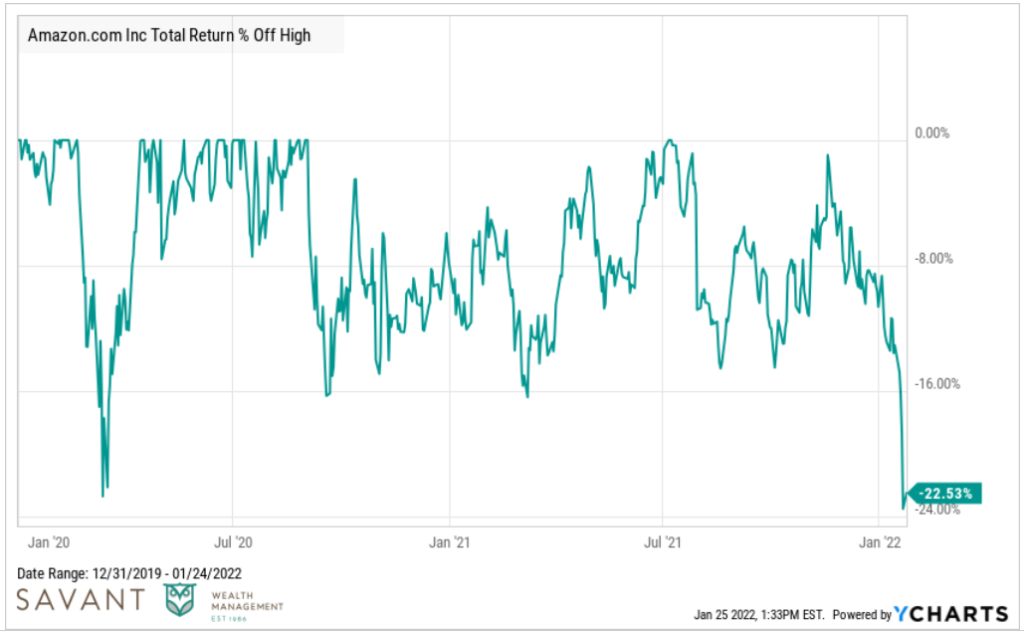
The single-day bear market for Netflix doesn’t exist in isolation. Amazon has fallen more this year than it ever did at the depths of March 2020.
In fact, the average stock in the NASDAQ 100 (largest technology stocks) is down roughly 25% from its 52-week high, while the average stock in the NASDAQ composite is down roughly 50% from 52-week highs.
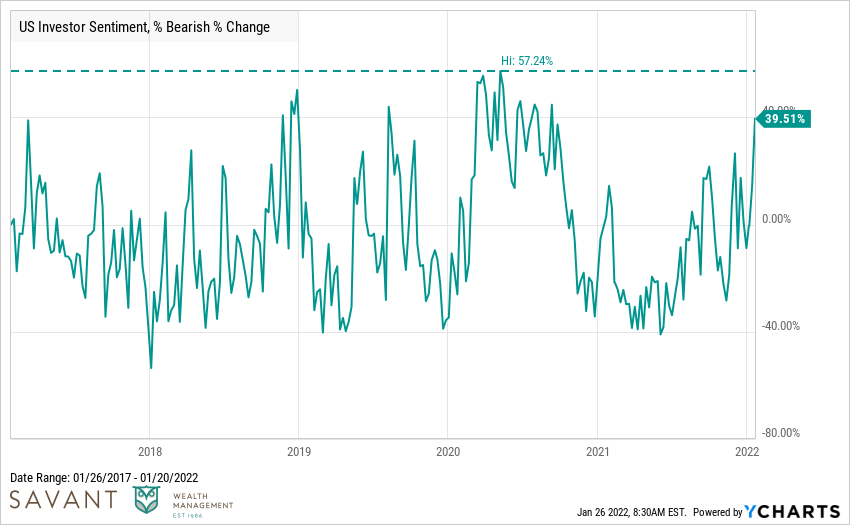
The fear is palpable. Market prices tend to drive sentiment, and according to survey data from AAII, investors are more bearish now than any time since May of 2020.
Like a teenager breaking curfew, markets never give great answers for doing what they do. However, we can infer this correction is some combination of:
- Inflation: highest inflation levels since 1982; what impact will it have on economic growth?
- Interest rates: will rising rates bring down equity valuations and slow down the market?
- The
BoogeymanFederal Reserve: if the Fed prioritizes fighting inflation, in effect reducing stimulus and money supply, will that cripple stocks?
All of this will be heavily debated going forward. But nobody has precise answers to these questions; it will only be obvious in hindsight.
But another, possibly overlooked factor driving stocks (assets) lower simply could be they went up too much to begin with. It was puzzling to watch growth stocks, cryptocurrencies, and other assets soar hundreds, even thousands of percent, in a short amount of time after the March 2020 lows.
Certainly, some of those returns were pure speculation, and we may now be living on the other side of it.
Glass Half Full
After a year with very little volatility, 2022 was likely due for a rockier ride.
The simplest advice for dealing with volatility is to acknowledge stock market corrections can’t be avoided, only endured. Unfortunately, the simplicity of this advice often dilutes its usefulness given many will overlook it.
Like the doctor who recommends you take two aspirin, it’s not the type of treatment or advice that will get written about in medical journals, but that doesn’t make it any less correct.
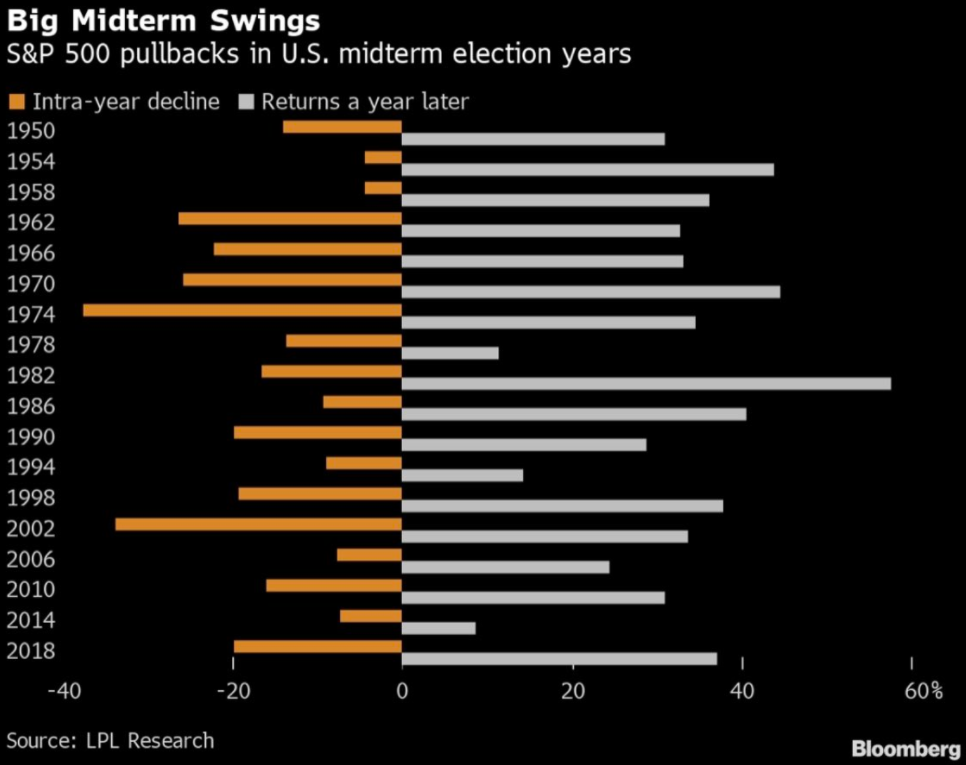
In diagnosing this market, recent declines have followed a consistent pattern from the past. 2022 is a mid-term election year, which historically tends to be more volatile than the average year.
Since 1980, the S&P 500 has seen an average annual drawdown of 14%, but in mid-term years, annual drawdowns were slightly higher – around 17%, per LPL Research. Mid-term years have been more volatile, so in one sense, nothing happening is out of whack.
The good news is the final three months of a mid-term year and the first two quarters of the following year have been some of the strongest periods for stocks.
Putting the mid-terms to the side, in general, significant market drawdowns tend to be followed by significant market gains.
Remember that 2020 brought about the fastest bear market in history that quickly turned into the fastest bull market in history. That type of fluctuation isn’t a regular occurrence in markets but it’s not exactly a major outlier either.
If we look at historical market data, nearly every correction since 1980 was followed by strong subsequent returns. Below is a list of all market corrections for the S&P 500 since 1980.
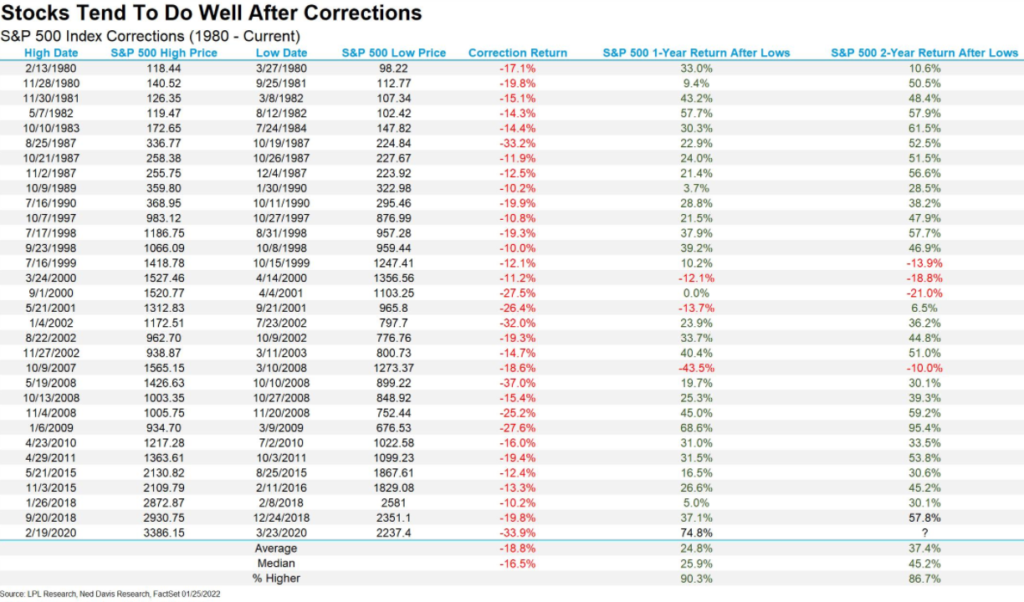
Based on this data, the following have been observed after a market correction:
- One year later, on average, the S&P 500 has been up 25% from the bottom, and the market was higher 90% of the time.
- Two years later, on average, the numbers get even better, with the market up 37% and higher 90% of the time.
- There have been 37 total corrections since 1980; in only four of those corrections was the market lower two years later.
To be clear, the market could go down more from here – that’s the nature of markets. But it’s important to remind yourself that none of this risk is new, and market corrections are perfectly normal.