
Earnings Season – The Market Predicted This

Google paid $1.6 billion in cash to buy YouTube in 2006. In Google’s most recent quarter, a measure of only 90 days, YouTube generated $7 billion in revenue alone. For comparison, Netflix, a YouTube competitor, garnered $7.4 billion in revenue in its most recent quarter.
YouTube only represents roughly 10 percent of Google’s total revenue but matches Netflix, one of the most valuable companies with a $230 billion market cap, in size and stature.
Google’s main business – internet search advertising – is no slouch either. Despite being more than 20 years old, Google’s search business achieved $36 billion in sales in the most recent quarter and grew at a 68% clip versus last year.
And Google isn’t an outlier.
Between Google, Apple, Microsoft and Amazon, their combined revenue over the past 12 months was roughly $1.2 trillion, with each company individually hitting an all-time high for revenues.
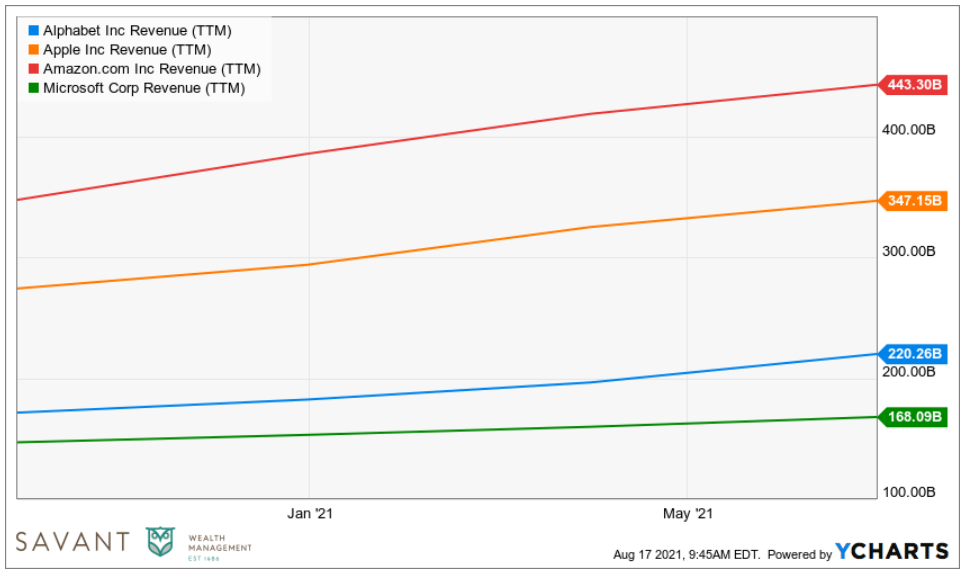
Source: Ycharts, data as of 8/6/2021.
If all that revenue was an individual country, it would have a larger Gross Domestic Product (GDP) than all but 14 countries. The numbers are getting so big it’s becoming hard to wrap your brain around them.
While the world doesn’t start or end with Big Tech, it’s hard to deny that it’s dominating.
This chart has been circulating online over the past few years – it shows how large Big Tech has gotten as a percentage of the market. The 10 largest technology companies represent nearly 30% of the S&P 500. Effectively, how they’ve performed, the market has performed.
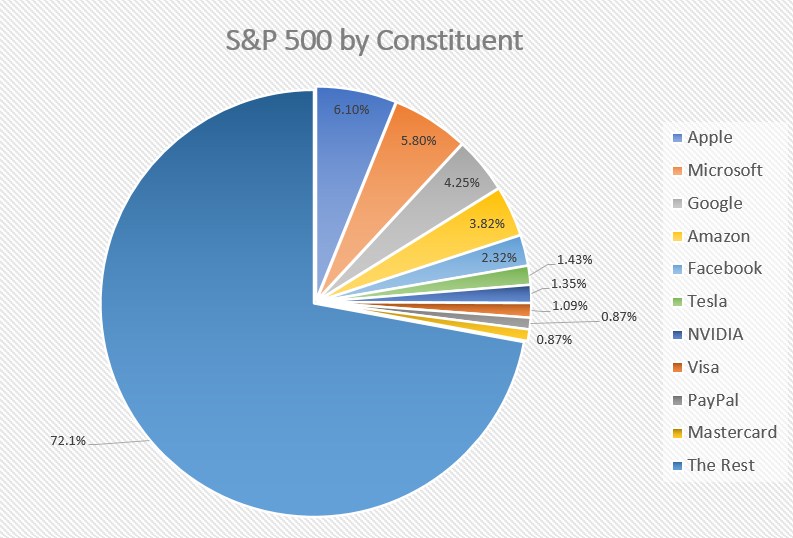
Source: Ycharts, data as of 8/6/2021.
The prevailing narrative over the past few years was Big Tech is carrying the market. But this year, the rest of the market is punching back.
Look no further than this recent earnings cycle. With second quarter earnings wrapping up – 80% of the S&P 500 has reported to date – numbers are at record highs across the board. It’s not just Big Tech.
With 80% of companies reported, S&P 500 earnings are on pace to hit a record high for the second consecutive quarter.
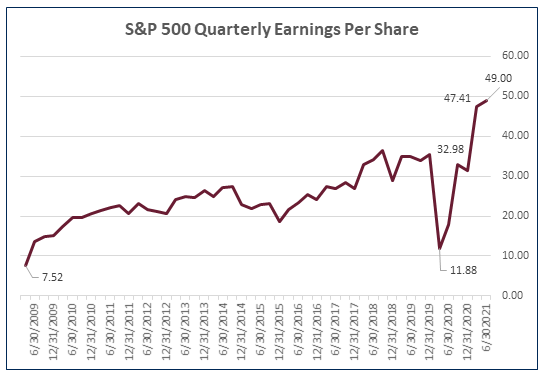
Data sources: Ycharts and S&P Dow Jones. Data as of 8/1/2021.
S&P 500 profit margins have risen to 13%, their highest level in more than 15 years.
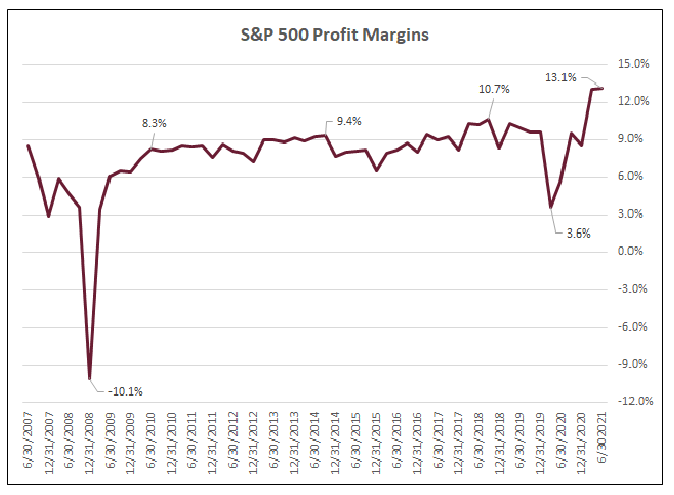
Data sources: Ycharts and S&P Dow Jones. Data as of 8/1/2021.
S&P 500 sales are up 18% versus last year, on pace for their largest increase ever.
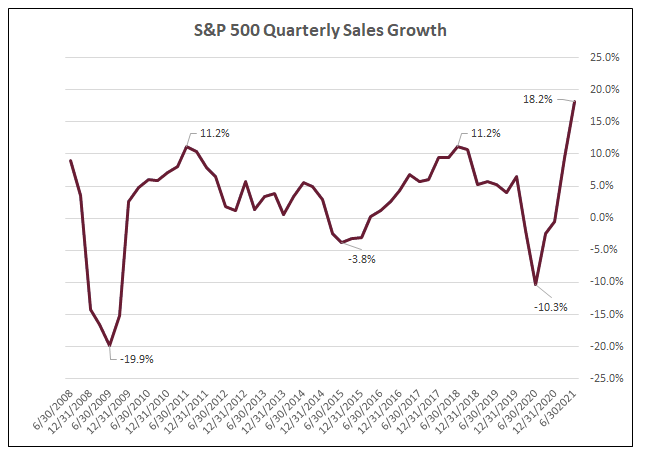
Data sources: Ycharts and S&P Dow Jones. Data as of 8/1/2021.
At a sector level, earnings are soaring higher. Nine of 11 S&P sectors achieved sales growth rates in the mid-teens or higher. Many industries that have been beaten down in recent years – Energy, Materials, Industrials – are all growing sales faster than Big Tech.
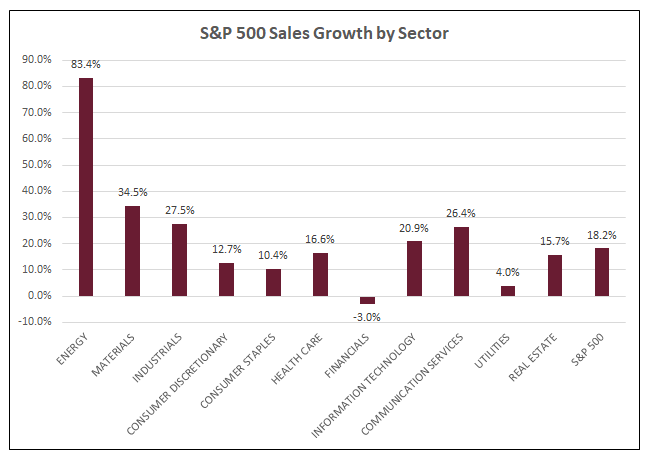
Data sources: Ycharts and S&P Dow Jones. Data as of 8/1/2021.
The numbers being reported are fantastic. It’s surprising but it probably shouldn’t be. The market foreshadowed these results more than a year ago.
The S&P 500 fell roughly 34% from its high last March but was back at all-time highs in the first week of August, only four months later. The market recovering that quickly seemed to indicate the pandemic’s impact would be similar to a natural disaster; severe but temporary, with nearly a full recovery once the risk has passed.
This hypothesis seems to have proven true – full recoveries are happening. You would need a CVS receipt (read: a really long, itemized list) to include everything that’s at an all-time high or achieved an all-time high this year. To name a few:
- The S&P 500
- Every single sector in the S&P 500
- NASDAQ
- Housing Prices
- Job Openings
- Household Net Worth
- GDP
You get the idea. All these things played a part in pushing sales, profits, and profit margins to record highs.
However, we need to acknowledge these trends could reverse. As they say, “the only cure for high prices is high prices.”
Many commentators have been taking their shot at calling “the bubble” in recent months. Maybe they’re right, maybe they’re not. But it’s likely more useful to try and understand what is going on rather than to try to predict what will happen.
No one has privileged access to know what the future holds and market forecasts are generally as accurate as calling a coin toss. If pundits call everything a bubble it dilutes the meaning of the word.
In the end, the winners write the history books in the stock market. And for now, (mostly) everything is winning.